TIMARU · OFFICIAL COUNCIL DATA
What's actually in Timaru's tap water
Timaru District Council answered with every chlorine reading in all twenty zones it runs - 1,510 of them - plus the lab chemistry behind them, Timaru city to Peel Forest. E. coli: zero detections in 956 samples. The water is safe. The same release shows what stays in it at the tap: chlorine in every zone, a lead trace in every zone, and in the Downlands zones the district's highest chlorination by-products. It also shows what treatment takes out: one raw bore ran lead at three times the legal limit before the plant. The free check reads your address.

THE HEADLINE NUMBERS
Twenty zones, lead in every one.
Your water passes New Zealand's rules. Timaru District Council treats it properly, and its own results show it - including the raw-source tests that show what the plants take out. The same results show what stays in the water at the tap. Every zone returned a lead trace, and Pareora's sits at 34% of the legal limit. The Downlands zones' by-products run hundreds of times above the EWG health guidelines. The numbers are below; what you do about them is up to you.
ZONE BY ZONE
What was found in your zone
Chlorine and the bacteria tests run through the year in every zone; metals and chlorination by-products a few times a year at Hill Labs. pH and turbidity were not part of the release. These are the council's own results. Typical figures are medians; peaks are the highest single sample.
| Zone | Chlorine, typical | THMs, highest sample | Haloacetic acids | Worth knowing |
|---|---|---|---|---|
| Timaru | 0.91 mg/L | 0.0087 mg/L | 0.012 mg/L | lead 0.00047 mg/L; the Opihi bore ran 0.016 raw, before treatment |
| Gleniti | 0.98 mg/L | 0.0193 mg/L | 0.024 mg/L | copper 0.026 mg/L, inside the 1.3 health goal; lead 0.00037 |
| Hadlow | 0.73 mg/L | 0.0191 mg/L | 0.026 mg/L | lead 0.00018 mg/L - the health goal is zero |
| Temuka | 0.73 mg/L | 0.0073 mg/L | Not detected | lead 0.00105 mg/L; two coliform detections, highest 43 MPN |
| Winchester | 0.74 mg/L | 0.0045 mg/L | 0.004 mg/L | copper 0.093 mg/L, inside the 1.3 health goal |
| Orari | 0.85 mg/L | 0.0025 mg/L | Not detected | lead 0.00055 mg/L - the health goal is zero |
| Geraldine | 0.69 mg/L | 0.0031 mg/L | Not detected | copper 0.013 mg/L; lead 0.0003 |
| Geraldine Downs | 0.72 mg/L | 0.0032 mg/L | Not detected | lead 0.00028 mg/L - the health goal is zero |
| Geraldine Flat | 0.71 mg/L | 0.0037 mg/L | Not detected | lead 0.0004 mg/L - the health goal is zero |
| Te Moana | 0.96 mg/L | 0.0208 mg/L | 0.031 mg/L | lead 0.00198 mg/L - 20% of the legal limit |
| Pleasant Point | 0.85 mg/L | 0.0198 mg/L | 0.025 mg/L | one coliform detection; lead 0.00029 |
| Seadown | 0.91 mg/L | 0.0115 mg/L | 0.013 mg/L | lead 0.00024 mg/L - the health goal is zero |
| Pareora | 0.56 mg/L | Not in the release | Not in the release | lead 0.0034 mg/L - 34% of the legal limit; copper 0.096 |
| Upper Pareora | 0.97 mg/L | Not in the release | Not in the release | chlorine peaked at 2.2 mg/L; lead 0.00152 |
| St Andrews | 0.60 mg/L | Not in the release | Not in the release | lead 0.00058 mg/L at the tap; the Springbrook bore ran 0.030 raw |
| Peel Forest | 0.83 mg/L | Not in the release | Not in the release | lead 0.001 mg/L - 10% of the legal limit |
| Rangitata Huts | 1.20 mg/L | Not in the release | Not in the release | chlorine peaked at 2.08 mg/L; lead 0.00153 |
| Sutherlands / Taiko | 0.91 mg/L | 0.0444 mg/L | 0.036 mg/L | lead 0.0021 mg/L, highest of 15 samples - 21% of the legal limit |
| Waimate Rural | 0.80 mg/L | 0.0472 mg/L | 0.04 mg/L | zinc 0.47 mg/L, under the taste threshold; lead 0.0018 |
| Waitohi / Totara Valley | 0.92 mg/L | 0.0316 mg/L | 0.031 mg/L | chlorine peaked at 2.0 mg/L; lead 0.00034 |
Source: Timaru District Council LGOIMA response, received 31 August 2026. Chlorine typicals are zone medians of every reading the council took, 3 January to 21 August 2026 - eight months, stated as released. E. coli and total coliforms are zone samples only, 29 July 2025 to 10 August 2026; the raw-river results in the same file never reach a zone row. THM and HAA figures are the highest per-sample totals, summing quantified species and reproducing the lab's own printed totals and compliance ratios; HAA sums the three acids the lab reports. Five zones - Pareora, Upper Pareora, St Andrews, Peel Forest and Rangitata Huts - carry no by-product results. Metals: lead was detected in every zone; mercury and antimony below detection everywhere, one cadmium trace at Waimate Rural. Raw-source failures flagged by the lab - Springbrook bore lead 0.030 and copper 2.8 mg/L, Opihi bore lead 0.016 - are bore water before treatment and are carried as notes, never as zone readings. All zone readings sit inside New Zealand's legal limits. pH and turbidity were not released; the response letter refers to the council website. No treated-water fluoride results, and no PFAS or microplastics tests anywhere in the release.
WHAT THIS MEANS FOR YOUR HOUSE
Three things to know.
Lead at the tap, in every zone
Lead does not come from the treatment plant. It is picked up on the way to your tap, from old pipes, solder and brass fittings. The council found it in all twenty zones - Pareora's 0.0034 mg/L is 34% of the legal limit and 17 times the EWG health guideline, and Sutherlands/Taiko, Te Moana and Waimate Rural all sit near 20%. The World Health Organization says there is no level of lead exposure known to be without harmful effects.
Why treatment matters: the Springbrook bore
The council also tests its raw sources, and the bore feeding St Andrews returned lead at 0.030 mg/L - three times the legal limit - and copper at 2.8 mg/L before treatment, both flagged as failures by the lab. The St Andrews tap read 0.00058. The Opihi bore feeding Timaru city ran 0.016 raw; the city zones read 0.00018 to 0.00047. The plants are doing their job. What they leave behind is the point of this page.
By-products in the Downlands, and what was not released
Chlorine meeting natural organic matter forms trihalomethanes and haloacetic acids. Waimate Rural's THM peak of 0.0472 mg/L is 314 times the EWG health guideline, and its haloacetic acid total of 0.04 mg/L is 400 times the guideline for that group - inside New Zealand's limits. pH and turbidity were not released, no fluoride result appears, and not one PFAS or microplastics test was run.
YOUR ADDRESS
This is the district picture. Get the report for your home.
The free water check takes about two minutes, and it includes the PDF water report for your address - written from the same release, read for your house.
THE SYSTEM THAT FITS
What we'd fit in Timaru.
The lead trace in every zone, the by-products in the Downlands and city zones, and the PFAS and microplastics nobody tests for only come out at the kitchen tap with reverse osmosis, and that's the ES60's job. If it's the chlorine in your showers that bothers you, that's a whole-house filter - we supply those by arrangement, so call us on 021 709 370.
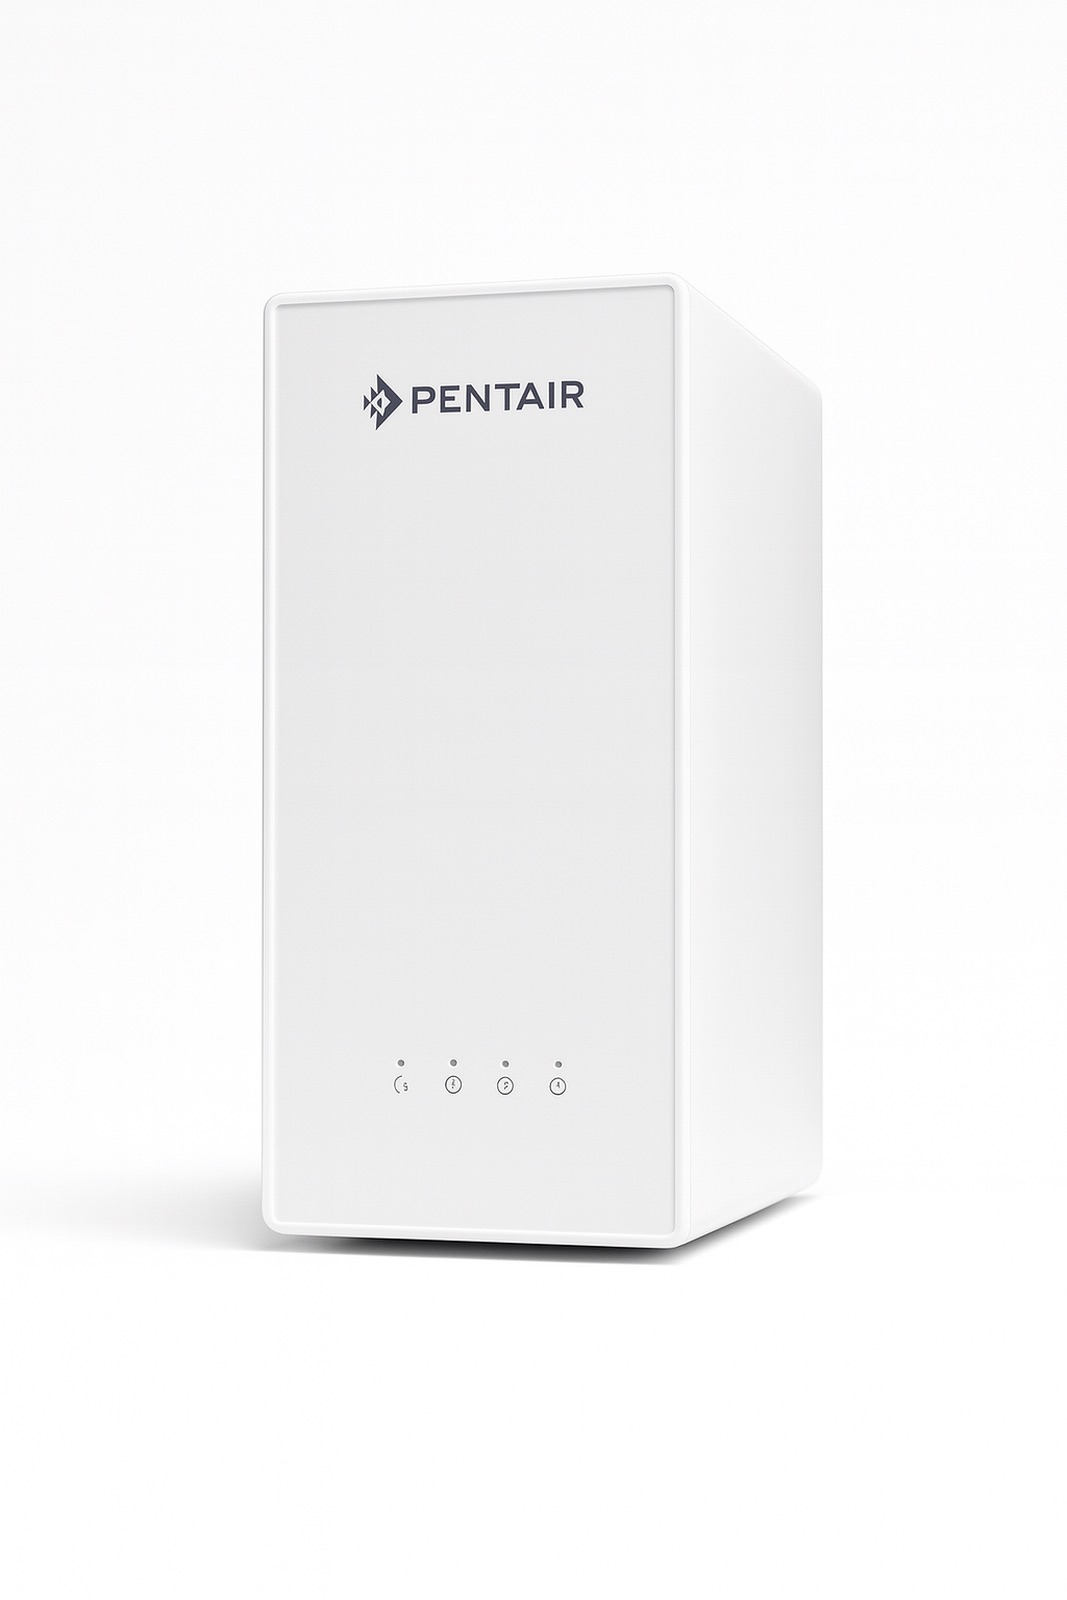
Under the sink · removes lead, THMs, PFAS and microplastics
Pentair ES60 under-bench RO
RRP $1,748 $1,595 Save $398
Independently lab-tested (report FW250926-28-C), including trichloromethane - the main THM. Reverse osmosis removes 99.9% of microplastics in published testing and 94%+ of PFAS. No tank, and it tells you when filters are due. Ships with the first year's refill free.
ViewTIMARU WATER QUESTIONS