WELLINGTON · OFFICIAL SUPPLIER DATA
What's actually in Wellington's tap water
Tiaki Wai answered on 9 October 2026 a request first sent to Wellington Water, with a calendar-2025 record for the 27 zones of the Wellington metropolitan supply - eleven in Wellington city, eight in Lower Hutt, five in Porirua, two in Upper Hutt, and Judgeford: 5,269 free chlorine results as a summary per zone, and metals and chlorination by-products result by result. What it shows: trihalomethanes in every zone, highest in Karori at 0.0385 mg/L, lead quantified in ten zones and never above 0.0013 mg/L, and fluoride results for one zone only, Johnsonville. What it does not hold: any E. coli, coliform, pH or turbidity result, though all four were asked for. The free check reads your address.
THE HEADLINE NUMBERS
Twenty-seven zones, by-products in every one.
Every result in the release sits inside New Zealand's legal limits. The same results show what stays in the water at the tap: trihalomethanes in every zone, 256 times the EWG health guideline at Karori's peak, and lead in ten zones at up to 6.5 times its guideline. As much of this page is what was not released: no bacteria, pH or turbidity results for any zone, and fluoride results for Johnsonville alone. The numbers are below; what you do about them is up to you.
ZONE BY ZONE
What was found in your zone
Free chlorine as a 2025 summary for each zone; trihalomethanes and haloacetic acids four to eight times in the year; the eight metals two to six times. These are Tiaki Wai's own results. Typical figures are medians; peaks are the highest single sample.
| Zone | Chlorine, typical | THMs, highest sample | Haloacetic acids | Worth knowing |
|---|---|---|---|---|
| Brooklyn (Wellington) | 0.63 mg/L | 0.0154 mg/L | Not detected | 165 chlorine results, 0.30 to 0.93 mg/L; THMs 102 times the EWG health guideline; lead not quantified |
| Churton (Wellington) | 0.57 mg/L | 0.023 mg/L | Not detected | 166 chlorine results, 0.32 to 0.90 mg/L; THMs 153 times the EWG health guideline; lead 0.0005 mg/L, inside the 0.01 limit |
| Eastern Wellington (Wellington) | 0.59 mg/L | 0.0134 mg/L | Not detected | 169 chlorine results, 0.31 to 0.98 mg/L; THMs 89 times the EWG health guideline; lead not quantified |
| Johnsonville (Wellington) | 0.60 mg/L | 0.017 mg/L | Not detected | 265 chlorine results, 0.31 to 0.96 mg/L; THMs 113 times the EWG health guideline; lead not quantified; the one zone with fluoride results, 0.76 mg/L typical |
| Karori (Wellington) | 0.57 mg/L | 0.0385 mg/L | Not detected | 165 chlorine results, 0.30 to 0.91 mg/L; THMs 256 times the EWG health guideline; lead not quantified |
| Kelburn (Wellington) | 0.57 mg/L | 0.0232 mg/L | Not detected | 217 chlorine results, 0.30 to 0.98 mg/L; THMs 154 times the EWG health guideline; lead not quantified |
| Onslow (Wellington) | 0.68 mg/L | 0.0232 mg/L | Not detected | 165 chlorine results, 0.36 to 0.99 mg/L; THMs 154 times the EWG health guideline; lead not quantified |
| Southern Wellington (Wellington) | 0.68 mg/L | 0.0164 mg/L | Not detected | 165 chlorine results, 0.30 to 0.98 mg/L; THMs 109 times the EWG health guideline; lead 0.0013 mg/L, inside the 0.01 limit |
| Tawa (Wellington) | 0.47 mg/L | 0.0342 mg/L | Not detected | 163 chlorine results, 0.20 to 0.96 mg/L; THMs 228 times the EWG health guideline; lead not quantified |
| Wadestown (Wellington) | 0.56 mg/L | 0.0262 mg/L | Not detected | 163 chlorine results, 0.34 to 0.98 mg/L; THMs 174 times the EWG health guideline; lead not quantified |
| Wellington Central (Wellington) | 0.60 mg/L | 0.0175 mg/L | Not detected | 319 chlorine results, 0.30 to 0.99 mg/L; THMs 116 times the EWG health guideline; lead 0.0011 mg/L, inside the 0.01 limit |
| Eastbourne (Lower Hutt) | 0.69 mg/L | 0.0012 mg/L | Not detected | 187 chlorine results, 0.30 to 0.98 mg/L; THMs 8 times the EWG health guideline; lead not quantified |
| Haywards (Lower Hutt) | 0.66 mg/L | 0.0355 mg/L | 0.006 mg/L | 237 chlorine results, 0.31 to 0.98 mg/L; THMs 236 times the EWG health guideline; lead 0.0008 mg/L, inside the 0.01 limit |
| Kelson (Lower Hutt) | 0.63 mg/L | 0.005 mg/L | Not detected | 160 chlorine results, 0.30 to 0.94 mg/L; THMs 33 times the EWG health guideline; lead 0.0013 mg/L, inside the 0.01 limit |
| Lower Hutt (Lower Hutt) | 0.66 mg/L | 0.0014 mg/L | Not detected | 291 chlorine results, 0.30 to 0.97 mg/L; THMs 9.3 times the EWG health guideline; lead 0.0012 mg/L, inside the 0.01 limit; copper 0.0661 mg/L, the highest in the release |
| Maungaraki (Lower Hutt) | 0.64 mg/L | 0.014 mg/L | Not detected | 161 chlorine results, 0.30 to 0.97 mg/L; THMs 93 times the EWG health guideline; lead not quantified |
| Petone (Lower Hutt) | 0.65 mg/L | 0.0039 mg/L | Not detected | 161 chlorine results, 0.32 to 0.98 mg/L; THMs 26 times the EWG health guideline; lead 0.0007 mg/L, inside the 0.01 limit |
| Stokes Valley (Lower Hutt) | 0.60 mg/L | 0.0124 mg/L | Not detected | 161 chlorine results, 0.32 to 0.96 mg/L; THMs 82 times the EWG health guideline; lead not quantified |
| Wainuiomata (Lower Hutt) | 0.58 mg/L | 0.0276 mg/L | Not detected | 171 chlorine results, 0.30 to 0.93 mg/L; THMs 184 times the EWG health guideline; lead 0.0007 mg/L, inside the 0.01 limit |
| Mana/Plimmerton/Paremata (Porirua) | 0.62 mg/L | 0.0209 mg/L | Not detected | 215 chlorine results, 0.32 to 0.95 mg/L; THMs 139 times the EWG health guideline; lead not quantified |
| Porirua High Level (Porirua) | 0.62 mg/L | 0.0188 mg/L | Not detected | 212 chlorine results, 0.31 to 0.94 mg/L; THMs 125 times the EWG health guideline; lead 0.0005 mg/L, inside the 0.01 limit |
| Porirua Low Level (Porirua) | 0.58 mg/L | 0.023 mg/L | Not detected | 162 chlorine results, 0.30 to 0.97 mg/L; THMs 153 times the EWG health guideline; lead not quantified |
| Pukerua Bay (Porirua) | 0.55 mg/L | 0.0195 mg/L | Not detected | 161 chlorine results, 0.31 to 0.99 mg/L; THMs 130 times the EWG health guideline; lead not quantified |
| Whitby (Porirua) | 0.63 mg/L | 0.0174 mg/L | Not detected | 162 chlorine results, 0.31 to 0.97 mg/L; THMs 116 times the EWG health guideline; lead not quantified |
| Pinehaven (Upper Hutt) | 0.64 mg/L | 0.0279 mg/L | Not detected | 204 chlorine results, 0.32 to 0.92 mg/L; THMs 186 times the EWG health guideline; lead not quantified |
| Upper Hutt Central (Upper Hutt) | 0.61 mg/L | 0.0297 mg/L | Not detected | 340 chlorine results, 0.30 to 0.97 mg/L; THMs 198 times the EWG health guideline; lead not quantified |
| Judgeford (Porirua) | 0.62 mg/L | 0.0212 mg/L | Not detected | 162 chlorine results, 0.30 to 0.98 mg/L; THMs 141 times the EWG health guideline; lead 0.0005 mg/L, inside the 0.01 limit |
Source: Tiaki Wai LGOIMA release, reference 26-217, letter of 9 October 2026 with one workbook, answering a 9 August 2026 request first sent to Wellington Water. Zone names are the national regulator's names for Tiaki Wai's zone codes; the release carries the codes only, and the city beside each name is read from the code. Chlorine figures are Tiaki Wai's own summary row per zone for calendar 2025 - count, minimum, median and maximum - and the underlying results are not in the release, so they are carried as supplied. THM figures are the highest per-sample sum of the quantified species, four to eight samples a zone; the share of New Zealand's combined limit is recomputed from the species, because the lab's printed ratio differs from its own species values on 21 samples. Haloacetic acids: six species per sample, below the reporting limit in every sample except dichloroacetic acid at 0.006 mg/L in Haywards on 25 March 2025. Metals: the eight plumbosolvency metals, two to six rounds a zone; antimony, cadmium and mercury were never quantified, chromium once (0.002 mg/L, Upper Hutt Central) and nickel once (0.0006 mg/L, Eastern Wellington). Fluoride: 51 results filed under the Johnsonville zone, the only zone-coded fluoride in the release. The release's treatment-plant results, plant fluoride included, are plant water with no zone-to-plant link and are not reported as any zone's figure. No E. coli, total coliform, pH or turbidity result for any zone, no source or treatment description, and no PFAS or microplastics tests anywhere in the release.
WHAT THIS MEANS FOR YOUR HOUSE
Three things to know.
By-products above the guideline, in every zone
Chlorine meeting natural organic matter forms trihalomethanes, and every one of the 27 zones returned them in 2025. Karori's peak of 0.0385 mg/L is 256 times the EWG health guideline and 31% of the way to New Zealand's combined limit; Haywards reached 0.0355, Tawa 0.0342 and Upper Hutt Central 0.0297, while Eastbourne and the Lower Hutt zone stayed under 0.002. Haloacetic acids were below the lab's reporting limit in every sample but one: dichloroacetic acid at 0.006 mg/L in Haywards on 25 March 2025, inside its 0.05 limit and 60 times the EWG health guideline for the group.
What was asked for and not released
The request asked for E. coli, total coliforms, pH and turbidity for every zone. None of it is in the release. On bacteria the letter says only this: "there was only 1 e.coli result for the distributions zones for the year and this was confirmed a contaminated sample with a FAC of 0.8mg/L so it is not included in the results". It does not name the zone, the date, the number of samples taken in the year or any coliform result. So this page makes no bacteria claim for any Wellington zone, either way, and carries no acidity or clarity figure. The release also describes no source and no treatment process, and does not say which of the four plants it names - Te Marua, Wainuiomata, Gear Island and Waterloo - feeds which zone.
Fluoride results for one zone, lead in ten, and a quiet volatile screen
Johnsonville is the only zone with fluoride results: 51 through 2025, 0.76 mg/L typical, 0.64 to 0.85, against a 1.5 legal limit. The release also carries fluoride results taken at the treatment plants, but it does not attribute them to zones, so this page states no fluoride level for any other zone. Lead was quantified in 10 of the 27 zones, highest 0.0013 mg/L in Kelson and Southern Wellington - inside the 0.01 limit and 6.5 times the EWG health guideline - and copper peaked at 0.0661 mg/L in the Lower Hutt zone against a 2 mg/L limit. A 25-compound volatile organic screen came back below its reporting limit in all but one of 2,800 results. Not one PFAS or microplastics test was run.
YOUR ADDRESS
This is the district picture. Get the report for your home.
The free water check takes about two minutes, and it includes the PDF water report for your address - written from the same release, read for your house.
THE SYSTEM THAT FITS
What we'd fit in Wellington.
THMs, and the PFAS and microplastics nobody tests for, only come out at the kitchen tap with reverse osmosis, and that's the ES60's job. If it's the chlorine in your showers that bothers you, that's a whole-house filter - we supply those by arrangement, so call us on 021 709 370.
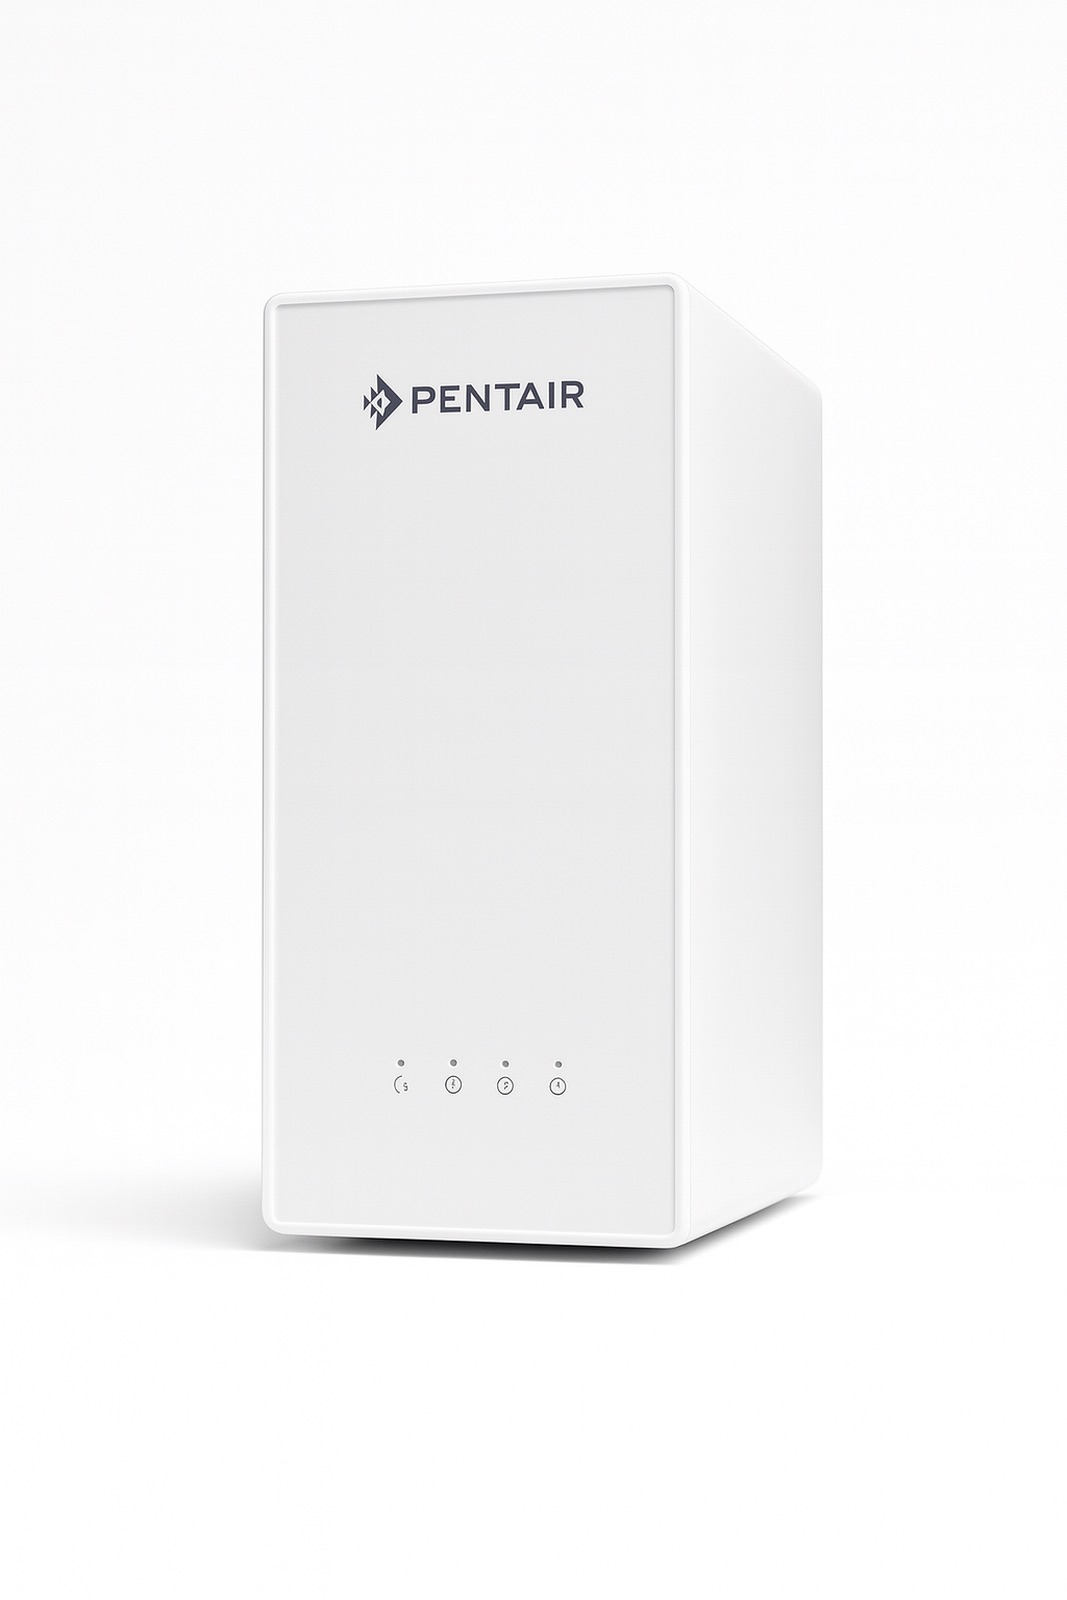
Under the sink · removes fluoride, THMs, PFAS and microplastics
Pentair ES60 under-bench RO
RRP $1,748 $1,595 Save $398
Independently lab-tested (report FW250926-28-C), including trichloromethane - the main THM. Reverse osmosis removes 99.9% of microplastics in published testing, 94%+ of PFAS, and around 90% of the fluoride where your supply adds it. No tank, and it tells you when filters are due. Ships with the first year's refill free.
ViewWELLINGTON WATER QUESTIONS