WHANGAREI · OFFICIAL COUNCIL DATA
What's actually in Whangarei's tap water
Whangarei District Council answered on 17 August 2026 with thirteen months of lab results for the six zones it runs - Whangarei, Hikurangi, Whangarei Heads, Bream Bay, Mangapai and Maungakaramea: 990 chlorine readings and 555 E. coli samples at 36 sampling positions, two metals rounds per zone, and chlorination by-products quarterly or monthly in four zones. What it shows: no E. coli in any zone sample, lead no higher than 0.00082 mg/L, and by-products in every zone tested for them - Bream Bay's trihalomethanes reached 72% of the New Zealand limit. The release has no treatment statement, so fluoride is reported here as measured. The free check reads your address.

THE HEADLINE NUMBERS
Six zones, by-products in every one tested.
Every zone reading in the release sits inside New Zealand's legal limits, and the council's own results show it - the raw river tests show what the plants take out. The same results show what stays in the water at the tap: trihalomethanes and haloacetic acids in all four zones tested for them, 517 times the EWG health guideline at Bream Bay's peak, and lead in every zone at up to 4.1 times its guideline. Fluoride is reported as the lab measured it. The numbers are below; what you do about them is up to you.
ZONE BY ZONE
What was found in your zone
Chlorine, pH and turbidity with every sample at the zone's sampling positions; E. coli and coliforms through the year; metals in two rounds; by-products quarterly, or monthly at Bream Bay. These are the council's own results. Typical figures are medians; peaks are the highest single sample.
| Zone | Chlorine, typical | THMs, highest sample | Haloacetic acids | Worth knowing |
|---|---|---|---|---|
| Whangarei | 1.08 mg/L | 0.0447 mg/L | 0.014 mg/L | fluoride below 0.1 mg/L in 13 of 26 results, 0.13 to 0.75 in the rest; 128 E. coli samples, none detected; lead 0.00082 mg/L at most, inside the 0.01 limit |
| Hikurangi | 1.10 mg/L | 0.0418 mg/L | 0.017 mg/L | fluoride 0.70 and 0.71 mg/L in its two results; 116 E. coli samples, none detected; lead 0.0004 mg/L |
| Whangarei Heads | 0.98 mg/L | 0.0341 mg/L | 0.008 mg/L | fluoride 0.53 and 0.63 mg/L in its two results; 125 E. coli samples, none detected; total coliforms once, 9 MPN per 100 mL at McLeod Bay; copper 0.022 mg/L, the district's highest |
| Bream Bay | 0.98 mg/L | 0.0776 mg/L | 0.03 mg/L | fluoride 0.68 mg/L typical across 16 results; THMs at 72% of the combined limit at Langs Beach on 9 December 2025; chlorine peaked at 1.72 mg/L; 130 E. coli samples, none detected |
| Mangapai | 1.10 mg/L | Not in the release | Not in the release | no fluoride result in the release; 28 E. coli samples, none detected; lead 0.00045 mg/L |
| Maungakaramea | 1.03 mg/L | Not in the release | Not in the release | no fluoride result in the release; 28 E. coli samples, none detected; lead 0.00019 mg/L |
Source: Whangarei District Council LGOIMA release, service request WT2615368, email of 17 August 2026 with one lab workbook; the covering email did not address the chemistry and treatment parts of the request. The release carries the council's own sampling-position codes and no zone codes; positions are placed in the regulator's six zones by name and checked against the regulator's own rows. Chlorine typicals are medians of the free chlorine measured with each sample at the zone's sampling positions, 1 July 2025 to 31 July 2026, 990 readings; pH and turbidity come from the same samples. E. coli and total coliforms: 555 zone samples, no E. coli, one total-coliform result. THM figures are the highest per-sample sum of the quantified species - quarterly at the Whangarei, Hikurangi and Whangarei Heads chemistry sites, monthly at three Bream Bay sites; one Langs Beach round in September 2025 read below detection for every species and is carried as reported. Haloacetic acids are per-sample sums of the acids that quantified, each held against its own limit in the report: dichloroacetic acid peaked at 0.017 mg/L against its 0.05 limit and trichloroacetic acid at 0.013 against 0.2, both at Bream Bay. Mangapai and Maungakaramea have no THM or haloacetic acid result. Metals: two rounds at each zone's chemistry sites. Fluoride figures are lab results at zone positions, as measured; the release holds no treatment statement, and plant and raw source results are carried as notes only. The regulator's national extract carries a bacteria-count unit on 24 Mangapai chlorine rows; in the council's workbook they are ordinary chlorine readings. No PFAS or microplastics tests anywhere in the release.
WHAT THIS MEANS FOR YOUR HOUSE
Three things to know.
By-products above the guideline, highest at Bream Bay
Chlorine meeting natural organic matter forms trihalomethanes and haloacetic acids, and most of Whangarei's water starts in rivers, springs and a dam. Bream Bay's peak, 0.0776 mg/L at Langs Beach on 9 December 2025, is 517 times the EWG health guideline and 72% of the way to New Zealand's combined limit. The Whangarei zone reached 0.0447, Hikurangi 0.0418 and Whangarei Heads 0.0341. Haloacetic acids quantified in all four of those zones - up to 0.03 mg/L at Bream Bay, with dichloroacetic acid at 0.017 against its 0.05 limit. Mangapai and Maungakaramea have no by-product result in the release.
Why treatment matters: rivers, springs and a dam
The council also tests its raw water, and the rivers show why the plants are there. E. coli turned up in all 30 samples from the Wairua River, the Ahuroa River, Poroti Springs and the Tauraroa River at Mangapai, and in 28 of 30 from the Hatea River, the Ruakaka River and the Whau Valley Dam, with counts into the thousands. The two Maungakaramea bores returned none in 30 samples each. That is untreated source water, and it is not your tap water: 555 zone samples, none with E. coli. The release does not describe how any plant treats its water.
Fluoride as measured, a little lead, and no arsenic
The release has no treatment statement, so this page reports fluoride as the council's lab measured it. In the Whangarei zone 13 of 26 results were below the 0.1 mg/L detection limit and the other 13 ran from 0.13 to 0.75; the two reservoirs sampled monthly, Puwera and Ormandy Road, read 0.61 to 0.74 mg/L from July to September 2025, were mostly below 0.1 from October 2025 to May 2026, and read 0.55 and 0.20 on 11 June 2026. Hikurangi, Whangarei Heads and Bream Bay read 0.53 to 0.79 mg/L in all but two of their 20 results. Lead was quantified in every zone, at most 0.00082 mg/L against a 0.01 limit, and arsenic was below detection in every zone sample. Not one PFAS or microplastics test was run.
YOUR ADDRESS
This is the district picture. Get the report for your home.
The free water check takes about two minutes, and it includes the PDF water report for your address - written from the same release, read for your house.
THE SYSTEM THAT FITS
What we'd fit in Whangarei.
Fluoride, THMs and the PFAS and microplastics nobody tests for only come out at the kitchen tap with reverse osmosis, and that's the ES60's job. If it's the chlorine in your showers that bothers you, that's a whole-house filter - we supply those by arrangement, so call us on 021 709 370.
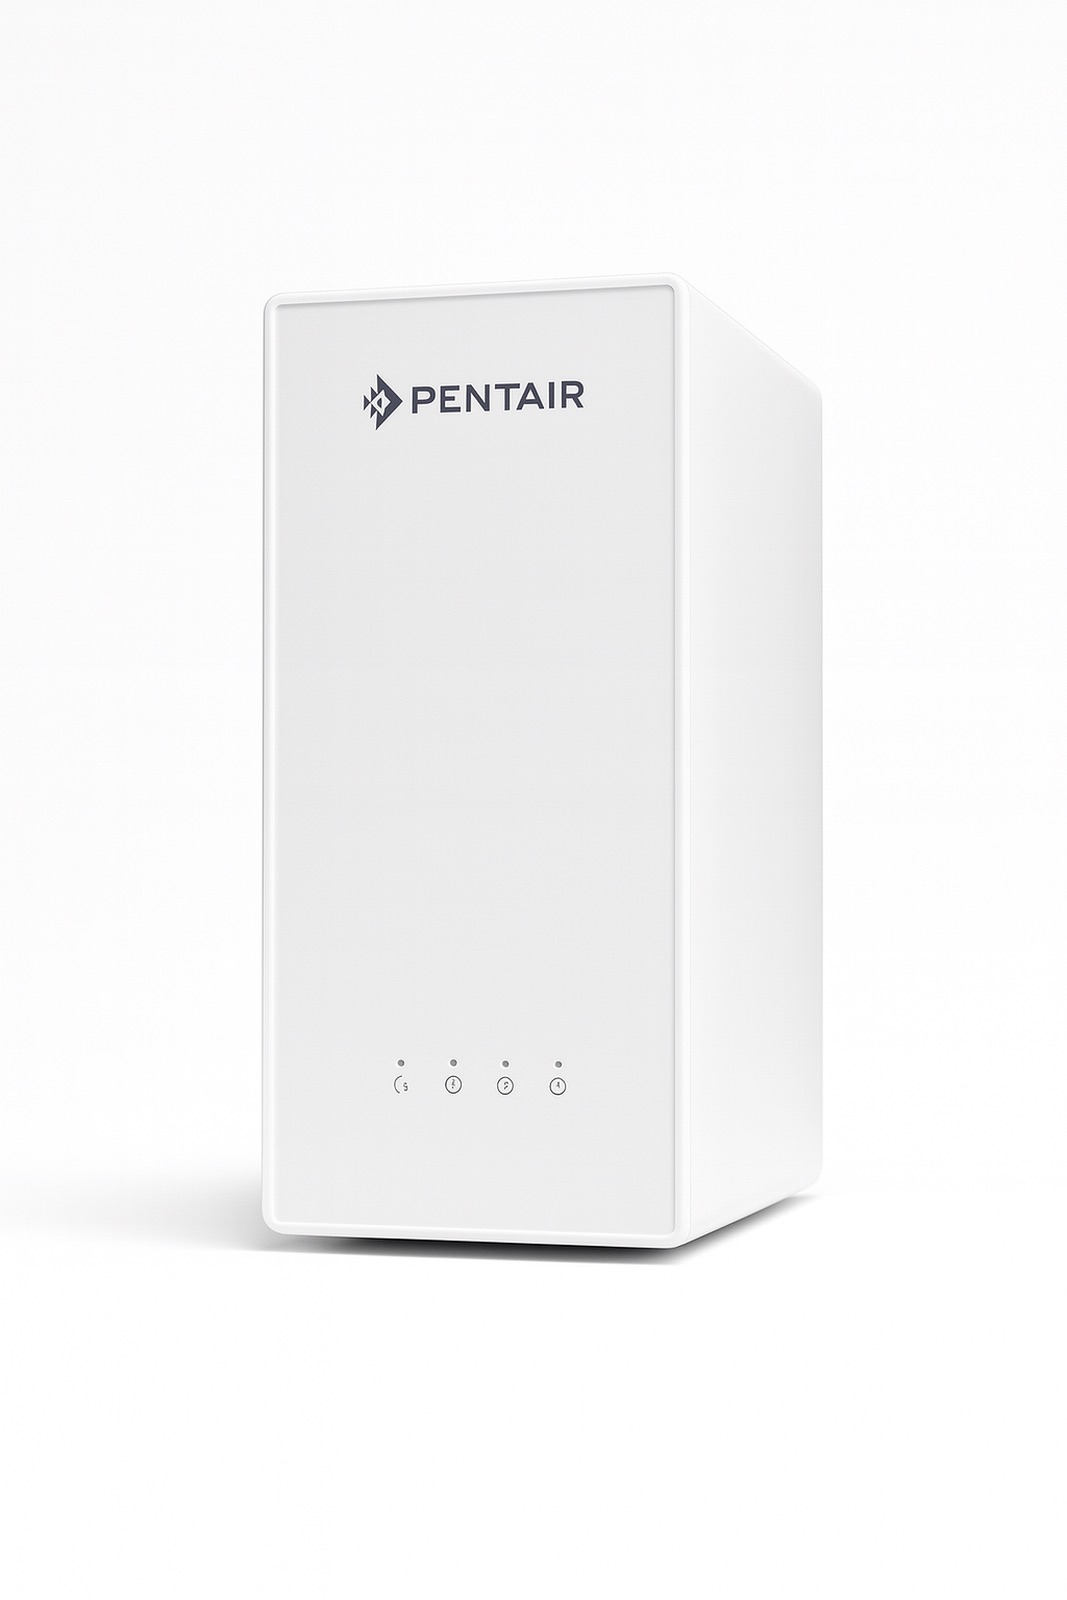
Under the sink · removes fluoride, THMs, PFAS and microplastics
Pentair ES60 under-bench RO
RRP $1,748 $1,595 Save $398
Independently lab-tested (report FW250926-28-C), including trichloromethane - the main THM. Reverse osmosis removes 99.9% of microplastics in published testing, 94%+ of PFAS, and around 90% of the fluoride where your supply adds it. No tank, and it tells you when filters are due. Ships with the first year's refill free.
ViewWHANGAREI WATER QUESTIONS